跳转到主要内容

向分析报告

正如在渲染过程报告章节中提到的,每次渲染一个被分析的屏幕时,该库都会发出一个 RenderPassReport 对象,该对象可以在 PerformanceProfiler 组件的 onReportPrepared 回调中访问。通过此回调,可以将报告发送到遥测服务。在本页中,我们将看到一个如何将 渲染过程报告 发送到 Amplitude 的示例。

Amplitude

在集成 Amplitude React Native SDK 后,您只需要一行代码即可将事件从 onReportPrepared 回调传递到 Amplitude

tsx
import {PerformanceProfiler, LogLevel} from '@shopify/react-native-performance';
import {track} from '@amplitude/analytics-react-native';
const App = () => {
...
return (
...
<PerformanceProfiler
logLevel={LogLevel.Debug}
onReportPrepared={report =>
track('react_native_performance', report)
}>
</PerformanceProfiler>
</>
);
};
export default App;

一旦您在仪表板上获得事件,就可以设置监视器,以显示您的屏幕随时间的性能如何。还可以添加渲染步骤的分解以及它们所花费的时间,以便更容易识别瓶颈。

Amplitude dashboard settings Amplitude dashboard

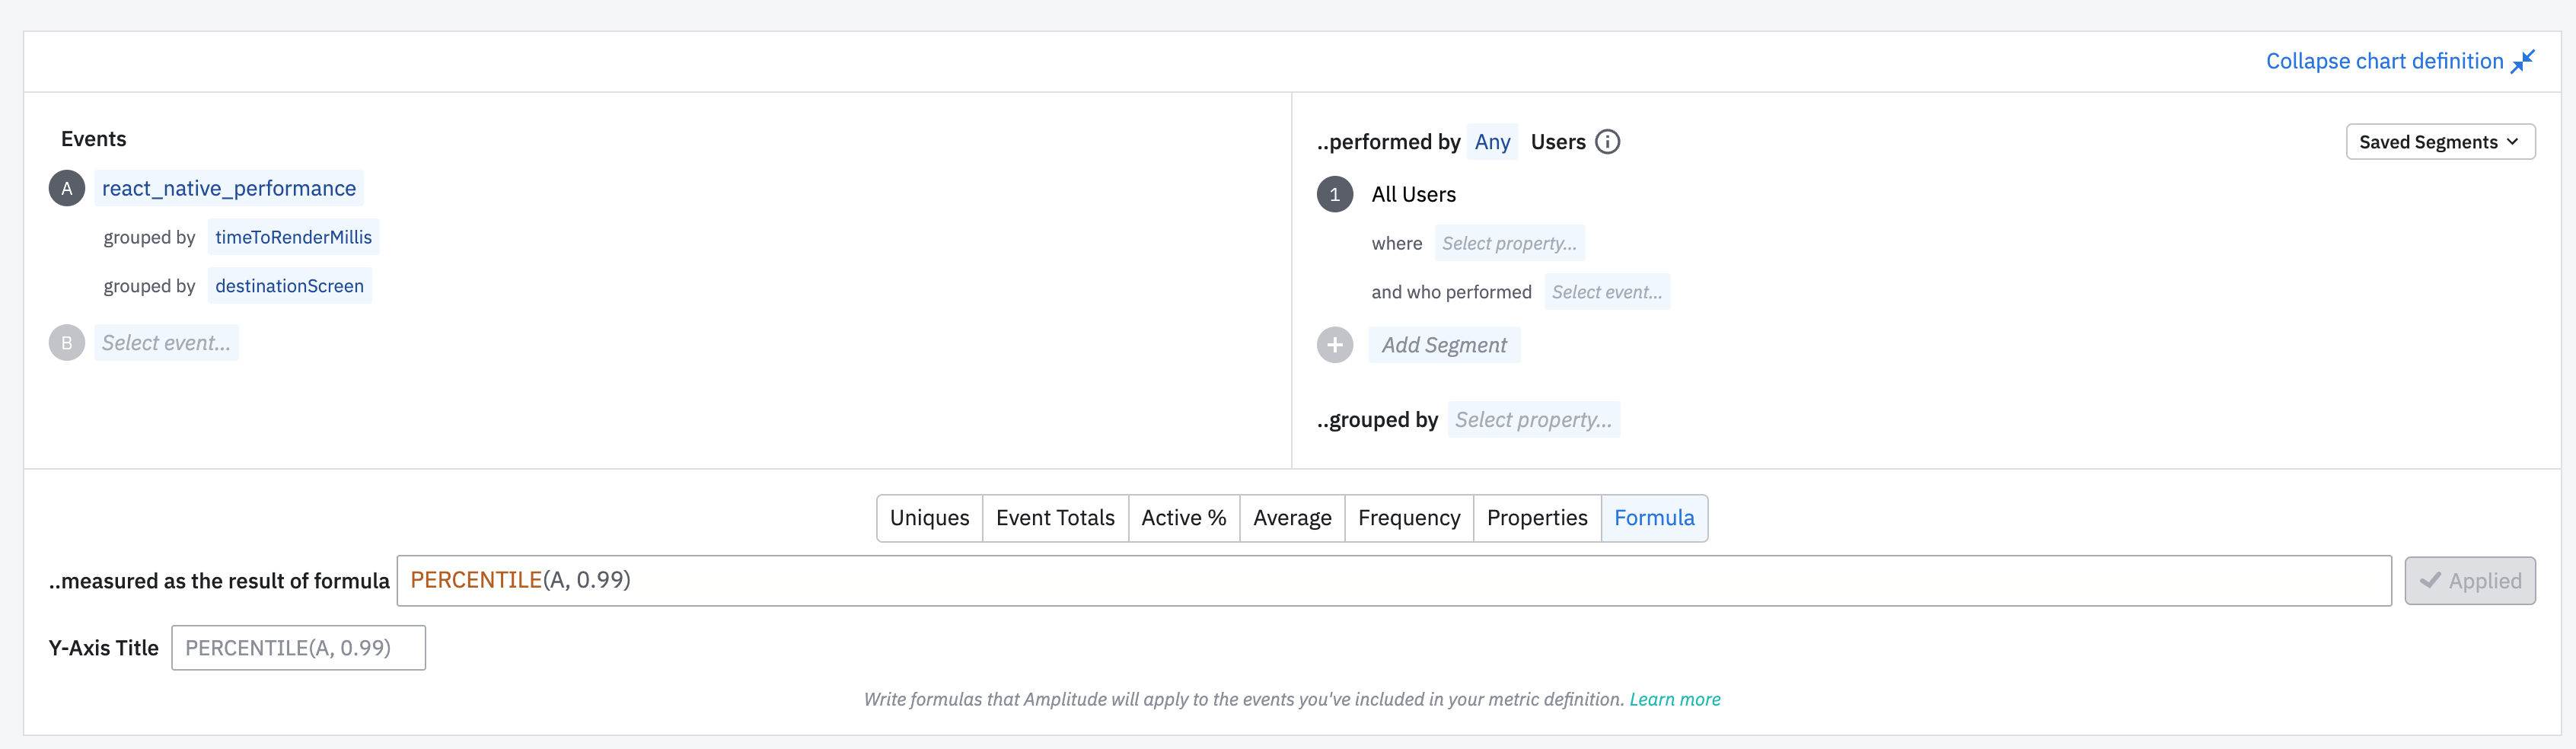
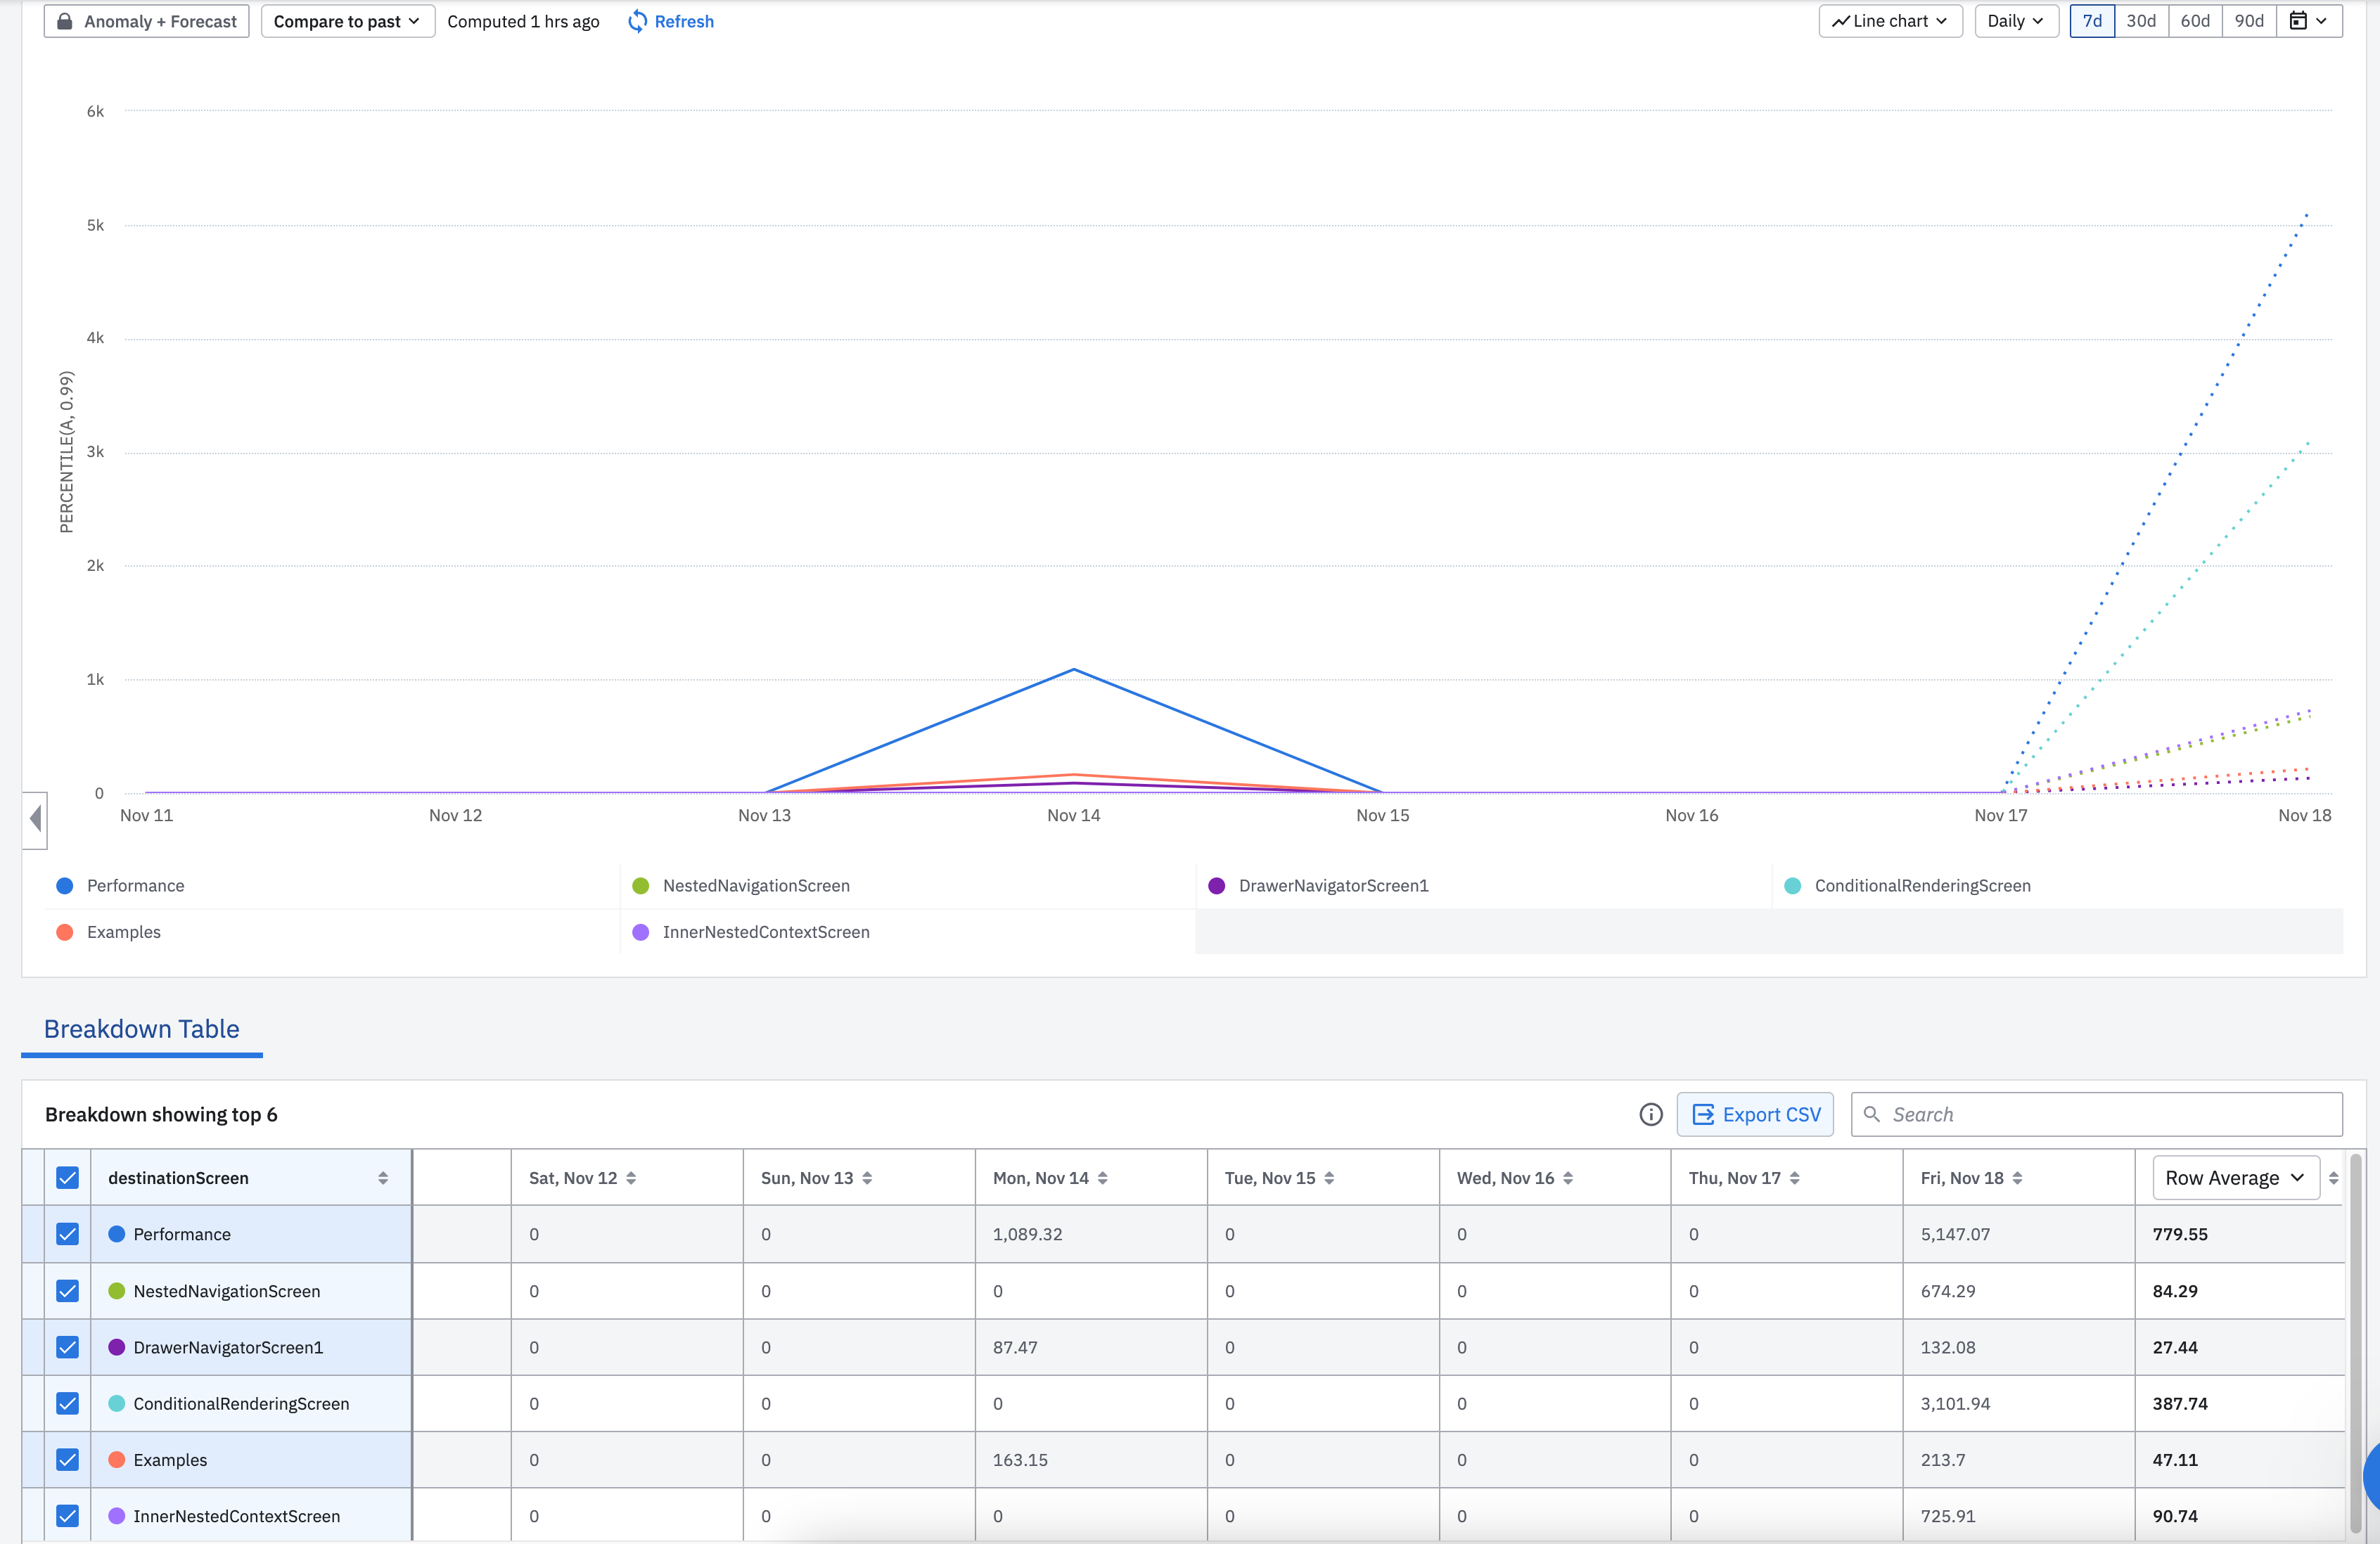
这是一个 Amplitude 仪表板的示例,它向我们展示了每个屏幕随时间的渲染时间。此仪表板使用由一个演示项目发送的事件,您可以在 react-native-performance-reporting-demo 存储库中查看该演示项目。